
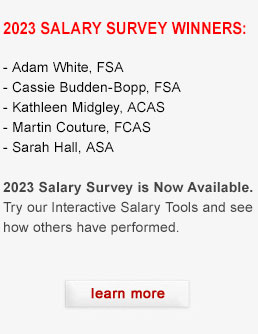
2012 Salary Survey Results
We are excited to present the results of our first Annual Actuarial Salary Survey. The information presented below represents responses to our confidential Salary Survey Questionnaire, which we emailed to 35,000 actuaries. We added to the survey responses information we gather on a regular basis from the actuaries we interview and place, as well as salary information from the companies we recruit for.
The survey results reflect 2012 salaries. Of the four types of charts, two are highly interactive and allow you to explore actuarial salary ranges against their relationship to: industry/specialization, geographic location, professional designation, number of exams completed and years of experience.
On our 2013 survey, scheduled for later this year, we will be expanding the amount and type of information we will be collecting from you. We urge you to participate, and will again be offering the opportunity to be eligible to win prizes just for contributing. The more actuaries that respond to the survey the more useful this tool will be in helping you in your career planning. It also is of great help to the companies we serve, by helping attract talent and remain competitive in the marketplace. Survey responses are always 100% confidential.
We especially welcome your feedback on these results, and your suggestions for adding to our survey later this year. For your convenience, we have added a comment box at the bottom of this page so you can quickly and easily share your thoughts. Your input is appreciated.
IMPORTANT DISCLAIMER: Respondents for this survey were selected from among those who have volunteered to participate in an online survey or in recruiting databases. The data have not been weighted to reflect the demographic composition of the actuarial community. Because the sample is based on those who initially self-selected for participation rather than a probability sample, no estimates of sampling error can be calculated. The results should be interpreted as directional in nature, and may not be generalizable to an individual’s employment/compensation situation.
Chart 1: Compensation by Selected Influential Factors
You must select one option in each category for every query you submit. Press Go to see results.
Show Me:| Salary Range: |
|
|
|
||||||||||||||||||||||||||
Chart 2: Base Salary by Location, Specialization and Years of Experience
You must select one option in each category for every query you submit. Press Go to see results.
Chart 3: Compensation by Specialization and Years of Experience
Base Salary + Bonus
Upper end of range reflects individual(s) with substantial annual bonus.
| Life & Annuities | Health | Investment/Risk | Pension | Property & Casualty | |
| 1-2 years | $60k - 101k | $60k - 90k | $61k - 95k | $65k - 90k | $55k - 109k |
| 3-5 years | $66k - 227k | $66k - 177k | $67k - 166k | $66k - 156k | $60k - 212k |
| 6-10 years | $82k - 335k | $76k - 405k | $96k - 770k | $68k - 168k | $78k - 282k |
| 11-15 years | $96k - 475k | $95k - 985k | $127k - 1,308k | $88k - 327k | $102k - 435k |
| 16-20 years | $88k - 613k | $87k - 720k | $122k - 409k | $84k - 360k | $111k - 1,235k |
| 21+ years | $90k - 2,120k | $110k - 850k | $90k - 1,050k | $90k - 508k | $113k - 2,177k |
| Life & Annuities | Health | Investment/Risk | Pension | Property & Casualty | |
| 1-2 years | $60k - 86k | $60k - 86k | $57k - 90k | $65k - 86k | $55k - 84k |
| 3-5 years | $66k - 135k | $64k - 140k | $66k - 150k | $66k - 134k | $60k - 150k |
| 6-10 years | $75k - 230k | $71k - 180k | $87k - 230k | $68k - 157k | $78k - 230k |
| 11-15 years | $90k - 475k | $89k - 258k | $111k - 275k | $85k - 275k | $90k - 300k |
| 16-20 years | $84k - 360k | $84k - 360k | $110k - 280k | $84k - 269k | $111k - 385k |
| 21+ years | $90k - 700k | $110k - 400k | $90k - 450k | $90k - 377k | $113k - 500k |
|
Select specialization to see the results. |
Chart 4A: Median Base Salaries for Selected Specialization by Years of Experience |
||||||||||||||||||||||||||||||||||||||||||||||||||||||||||||||||||||||||||||||||||||||||||||||||||||||||||||||||||||||||||||||||||||||||
|
||||||||||||||||||||||||||||||||||||||||||||||||||||||||||||||||||||||||||||||||||||||||||||||||||||||||||||||||||||||||||||||||||||||||
Chart 4B: Median Base Salaries for Selected Specialization by Professional Credentials |
||||||||||||||||||||||||||||||||||||||||||||||||||||||||||||||||||||||||||||||||||||||||||||||||||||||||||||||||||||||||||||||||||||||||
|
Be Counted – Be Informed
Beginning November 1st of 2016 and ending January 31st 2017 and every year thereafter, we will again be offering the opportunity to be eligible to win prizes just for contributing to the Salary Survey. We urge you to participate. If you contribute every year, you earn more chances to win! For each year you participate, you will accumulate additional chances to win (i.e. contribute three years, earn three entries in the drawing). The more actuaries that respond to the survey the more useful this tool will be in helping you in your career planning. It also is of great help to the companies we serve, by helping attract talent and remain competitive in the marketplace. Survey responses are always 100% confidential.
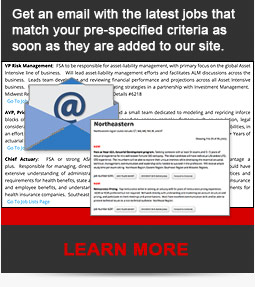
GET JOBS BY E-MAIL, THE MOMENT THEY ARE PUBLISHED!
With this feature you can receive email notifications with the latest jobs that match your pre-specified criteria the moment they are added into our database. Click here to fill out our form and outline your criteria and specifications to subscribe to this program. The email you will receive will allow you to modify your criteria or opt-out of your program at anytime.
 Lauren Lee, Assistant Vice President
 Lindsey Nelson, Vice President
 Kieran Michaels, Vice President

 Barbara Roman, Senior Vice President
 Jill Grayson, Executive Vice President
 Jennifer Hart, Executive Vice President
 Jesse West, Executive Vice President
 Aimee Kaye, President
 Bonnie Ten-Pow, Vice President, Director – Administrative Services
 Claudine Cox, Executive Vice President
 Robyn Taylor, Senior Vice President
 Stephen Frost, Director of Research
 Patty Kent, Executive Vice President